
Statistics
From data types to confidence intervals: describing data, judging a population from a sample, and comparing two variables.
Topic Importance
Statistics closes out the likelihood side of Paper Two. It has appeared in 23 questions over the last 12 years — every single year without fail — and it needs almost nothing studied before it.

It is also the largest topic in our course by content: fifteen articles and over a hundred custom questions. That reflects the exam: statistics questions range from reading data types to building confidence intervals, and the marks are there every year for anyone who has worked through the chain of ideas.
What the Topic Covers
The topic follows a deliberate arc. It starts with what data is: the types and classifications — qualitative versus quantitative, and within quantitative, discrete versus continuous.
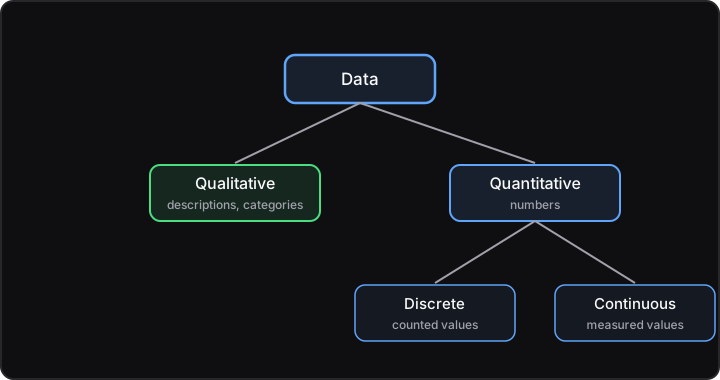
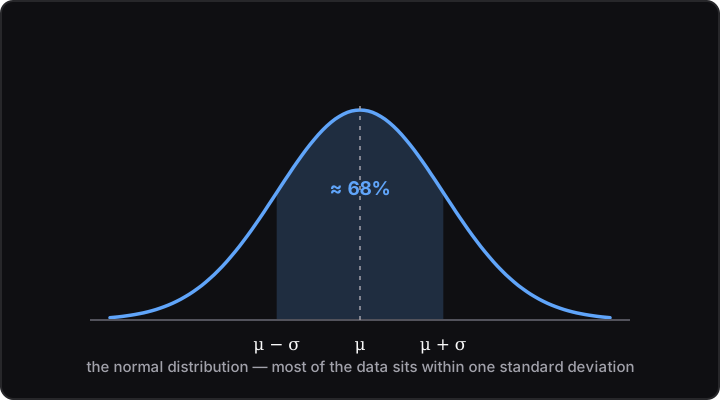
Then how data is collected — sampling methods and their biases — and how it is analysed: the averages (mean, median, mode) and the spread, first through quartiles and the interquartile range, then through normal distributions and standard deviations.
The next block is the topic's real destination: judging a whole population from a sample. Sampling distributions and the central limit theorem explain why sample means behave predictably, standard errors measure how much they wander, and confidence intervals — and their applications — turn all of it into statements about the population.
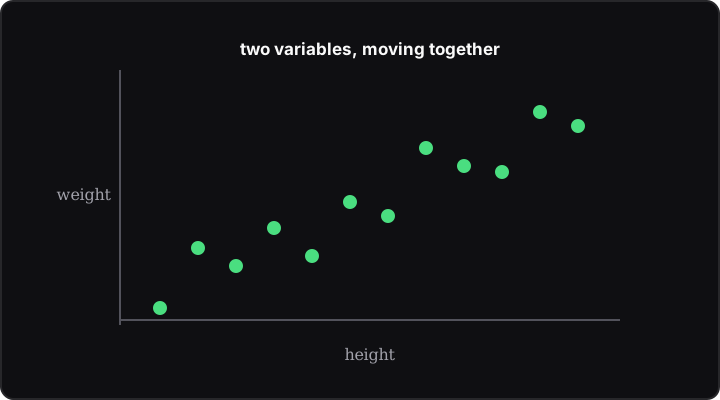
The final sub-topic changes the question: instead of one attribute (the height of people), correlations compare two variables — such as height and weight — and measure how they move together.
The mean of five numbers is 12. Four of them are \(10,\; 11,\; 13,\; 15\). Find the fifth number.
A sample of 100 measurements has mean 68 and standard deviation 4. Construct a 95% confidence interval for the population mean.
Exam Correlations
Statistics appears 23 times over 12 years, and its correlation table is the shortest in the series: probability with 6 shared questions, algebra with 1, and nothing else at all.
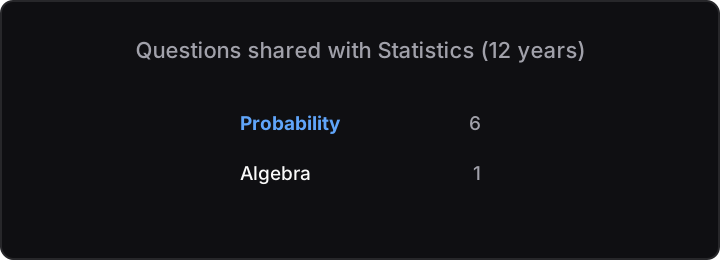
A note on the counts: "Algebra" bundles Algebra 1 and Algebra 2 together. The probability number is the bundling described in the Paper Two overview — one question with a statistics part and a probability part, sometimes sharing the same data — rather than a deep overlap in ideas. Beyond that, the table is empty, which tells you something rare: statistics really is as self-contained as it looks.
A statistics question has appeared every single year, and answering it needs almost nothing from the rest of the course. For marks per prerequisite, statistics is one of the best deals on either paper.
Concept Connections
Statistics sits at the end of the likelihood side with the lightest prerequisites of any topic this size: a bit of Algebra 1, and a tiny bit of probability.
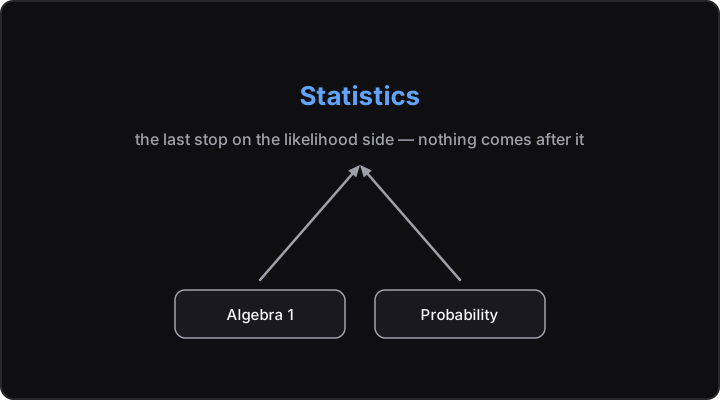
And outward? Nothing comes after statistics. Finishing it completes the likelihood side of Paper Two.
Study Order
There are nine sub-topics in Statistics, in three blocks: describing data, judging a population from a sample, and comparing two variables. Click each step to see how they build.
Describing data — what it is, how it is collected, how it behaves
Data Types and Classifications
The starting vocabulary: qualitative versus quantitative data, and within quantitative, continuous versus discrete. Every later technique starts by asking what kind of data it is looking at.
Sampling Methods and Their Biases
How data gets collected, and how collection can go wrong: simple random sampling, quota sampling, cluster sampling, and stratified sampling — each with the biases it invites.
Averages
The three centres of a data set — the mean, the median, and the mode — and when each one is the right summary.
Quartiles and the Interquartile Range
The first measure of spread, building directly on the median: quartiles split the ordered data into four parts, and the interquartile range measures the width of the middle half.
Normal Distributions and Standard Deviations
The second measure of spread, and the most important shape in statistics: the bell curve. The standard deviation measures spread around the mean, and the z-value counts how many standard deviations a value sits from it.
From sample to population — judging the whole from a part
Sampling Distributions and the Central Limit Theorem
The idea that makes inference possible: take many samples and their means form a distribution of their own — and the central limit theorem says that distribution is approximately normal, whatever the population looked like.
Standard Errors and Confidence Intervals
How much does a sample mean wander from the true mean? The standard error measures it, shrinking as samples grow — and wrapping the sample mean in about two standard errors gives the 95% confidence interval.
Applications of Confidence Intervals
The machinery applied: judging the actual population you are studying from the sample you have — the payoff of the whole build-up from sampling methods onwards.
Comparing variables — from one attribute to two
Correlations
Everything so far studied one attribute at a time — the height of people, say. The final sub-topic compares two variables, such as height and weight, and measures how strongly they move together.
Know your gaps before the exam does
The MathsHelp course is everything you need for Leaving Cert Higher Level Maths, in one place. Smart testing pinpoints exactly where you are losing marks, explainer articles teach you the curriculum, an AI tutor works through your specific weaknesses, and real past papers — organised by topic, with guides — prove you are exam-ready.
- 15 articles on this topic
- 122 questions on this topic
- 1,300+ custom questions
- 280 explainer articles
- 12 years of past papers by topic